

Understanding the Best Diagrams for API Design

A
I am an enthusiastic researcher and developer with a passion for using technology to innovate in business and education.
Search for a command to run...
I am an enthusiastic researcher and developer with a passion for using technology to innovate in business and education.
No comments yet. Be the first to comment.
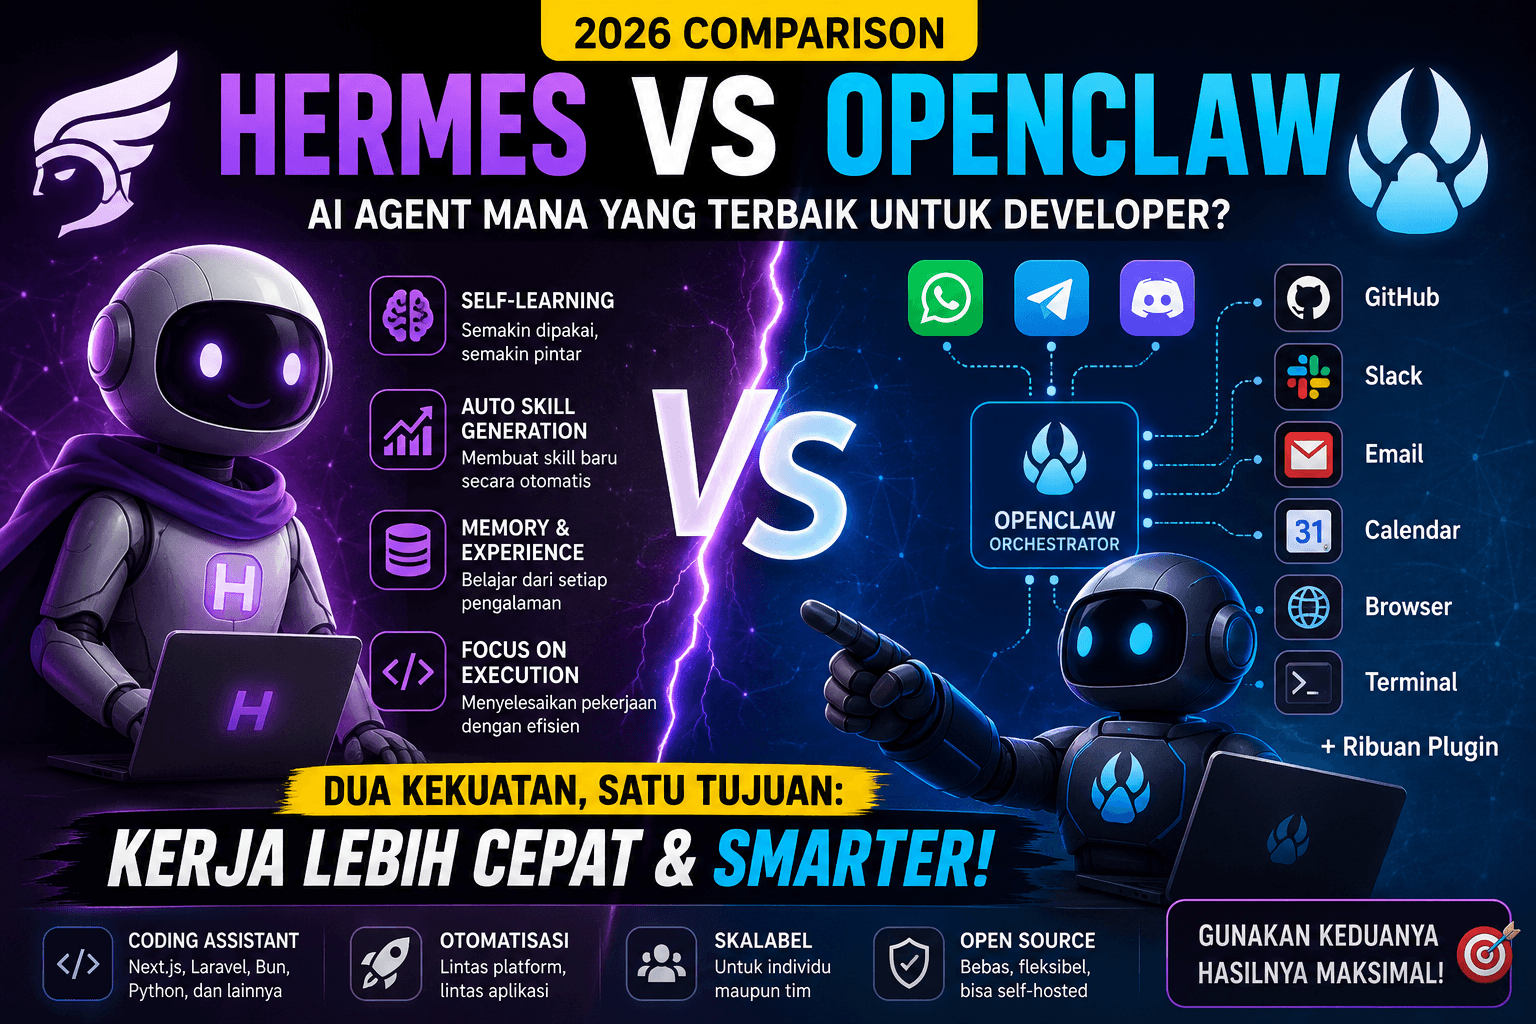
Ringkasan: Jika OpenClaw adalah AI Operating System yang menghubungkan berbagai layanan dan agent, maka Hermes adalah AI Worker yang fokus mengerjakan pekerjaan, belajar dari pengalaman, dan semakin p
Ketika membangun aplikasi modern seperti Next.js, Cloudflare Workers, platform AI, microservices, atau real-time dashboard, ada banyak istilah jaringan yang sering muncul: TCP, UDP, HTTP/2, QUIC, WebS

Setiap tahun, ribuan mahasiswa jurusan Teknologi Informasi, Sistem Informasi, dan Teknik Informatika diwisuda. Namun, tidak sedikit di antara mereka yang kemudian menghadapi kenyataan yang cukup berat

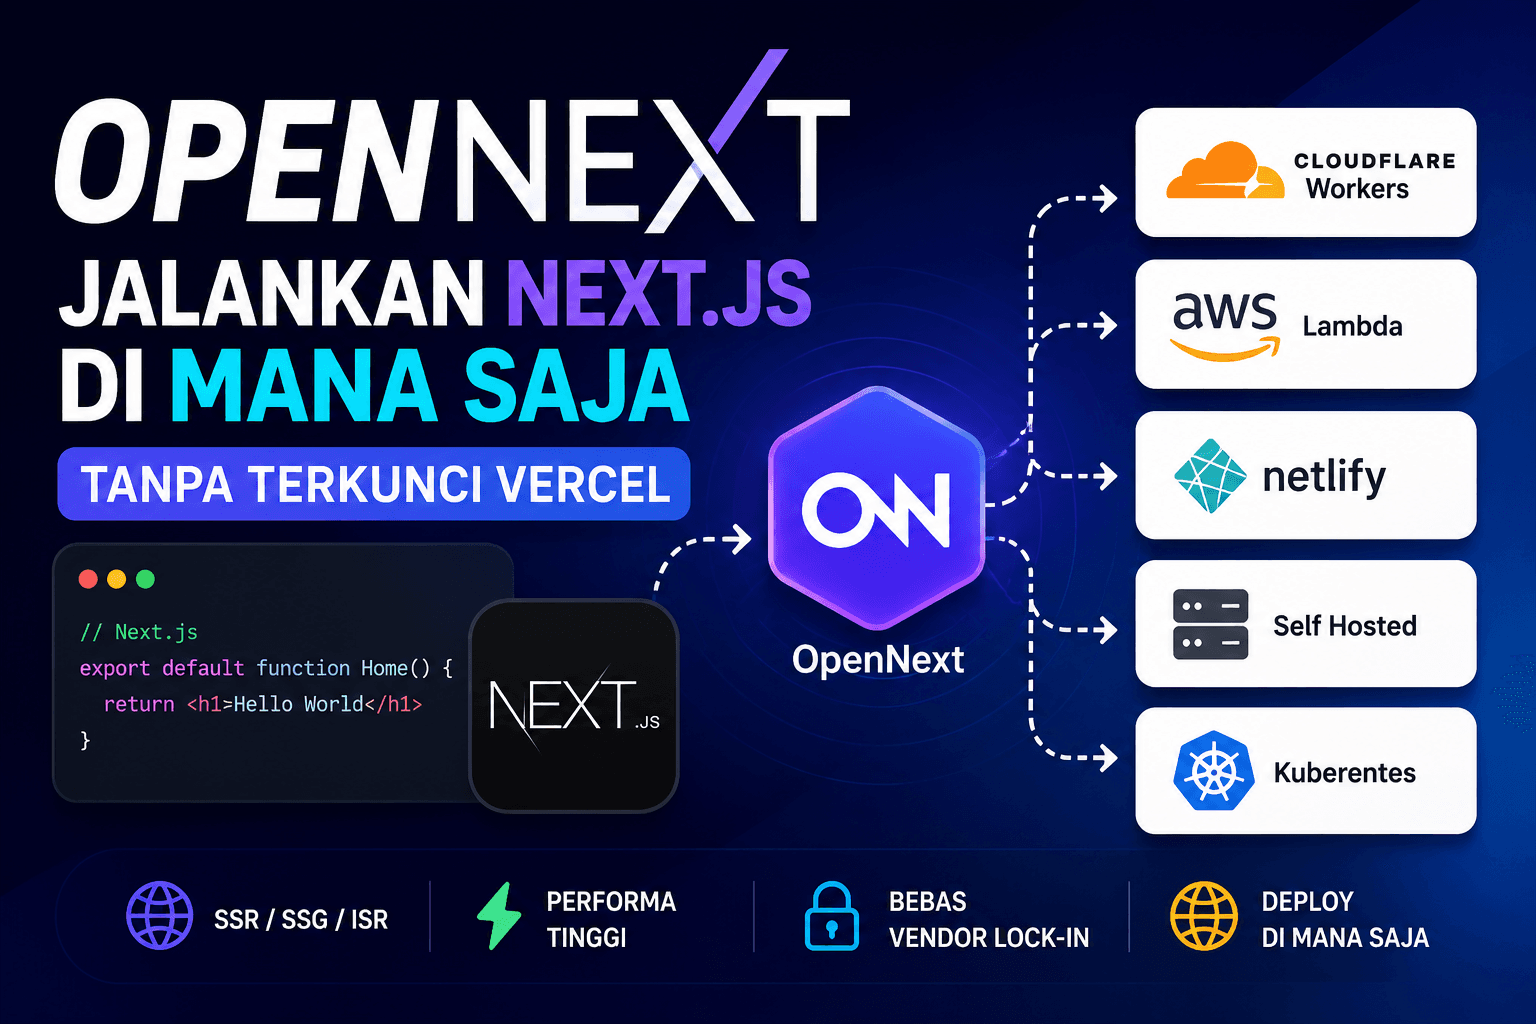
Jika Anda menggunakan Next.js, kemungkinan besar Anda pernah mendengar anggapan bahwa: "Next.js = Vercel" Padahal kenyataannya tidak harus demikian. Di sinilah OpenNext hadir. OpenNext adalah proyek
Saat pertama kali mencoba OpenCode Go, saya hampir langsung berlangganan tanpa membaca detail program yang mereka sediakan. Untungnya saya menemukan bahwa OpenCode memiliki program referral yang membe

Designing an API involves careful planning and clear visualization of its structure, behavior, and interactions. Using diagrams can significantly enhance understanding and communication among developers, stakeholders, and clients. Here are the most suitable types of diagrams for API design and when to use them.
A system architecture diagram illustrates how the API interacts with other components in the system. It provides a high-level overview of the API’s role in the broader ecosystem.
Use Case: Show the API’s connections with frontend, backend, databases, and external services.
Best Tools: UML Component Diagram, C4 Model (Level 2: Container Diagram).
Example: Depicting an API mediating between a mobile app and a database.
A process flow diagram is ideal for visualizing the flow of data or the logic of operations in the API.
Use Case: Represent the step-by-step process of handling a request and producing a response.
Best Tools: Lucidchart, draw.io.
Example: Illustrating a user authentication flow where the client sends credentials, the API validates them, and the server generates a token.
Sequence diagrams are perfect for detailing interactions between the client and the server, including the order of operations.
Use Case: Map out how requests and responses are handled, emphasizing sequence and timing.
Best Tools: PlantUML, Visual Paradigm.
Example: Showing a client’s interaction with an API endpoint to retrieve a list of items.
An ERD focuses on the data structures managed by the API, especially if the API interfaces with a database.
Use Case: Design database schemas related to API operations.
Best Tools: MySQL Workbench, dbdiagram.io.
Example: Structuring tables for a user management system with entities like Users, Roles, and Permissions.
Although not a diagram, OpenAPI or Swagger provides a structured way to document and visualize an API’s endpoints, methods, and data formats.
Use Case: Define endpoints, HTTP methods (GET, POST, PUT, DELETE), request bodies, and responses in detail.
Best Tools: Swagger Editor, Stoplight, Postman.
Example: Generating interactive API documentation for developers.
State diagrams are used to represent the different states an object can have and how they transition due to API interactions.
Use Case: Track the lifecycle of an entity, such as the status of an order (e.g., Pending, Processed, Completed).
Best Tools: Lucidchart, PlantUML.
Example: Depicting how an order’s state changes via API calls.
The choice of diagram depends on the aspect of the API you want to highlight:
Use System Architecture Diagrams for high-level overviews.
Use Sequence Diagrams for detailed client-server interactions.
Use ERDs for database schema design.
Use State Diagrams for lifecycle representation.
Use OpenAPI for comprehensive endpoint documentation.
By using the appropriate diagrams, you can simplify complex concepts, reduce miscommunication, and ensure a well-structured API design. Whether you are presenting to stakeholders or collaborating with developers, visual tools will streamline your API development process.